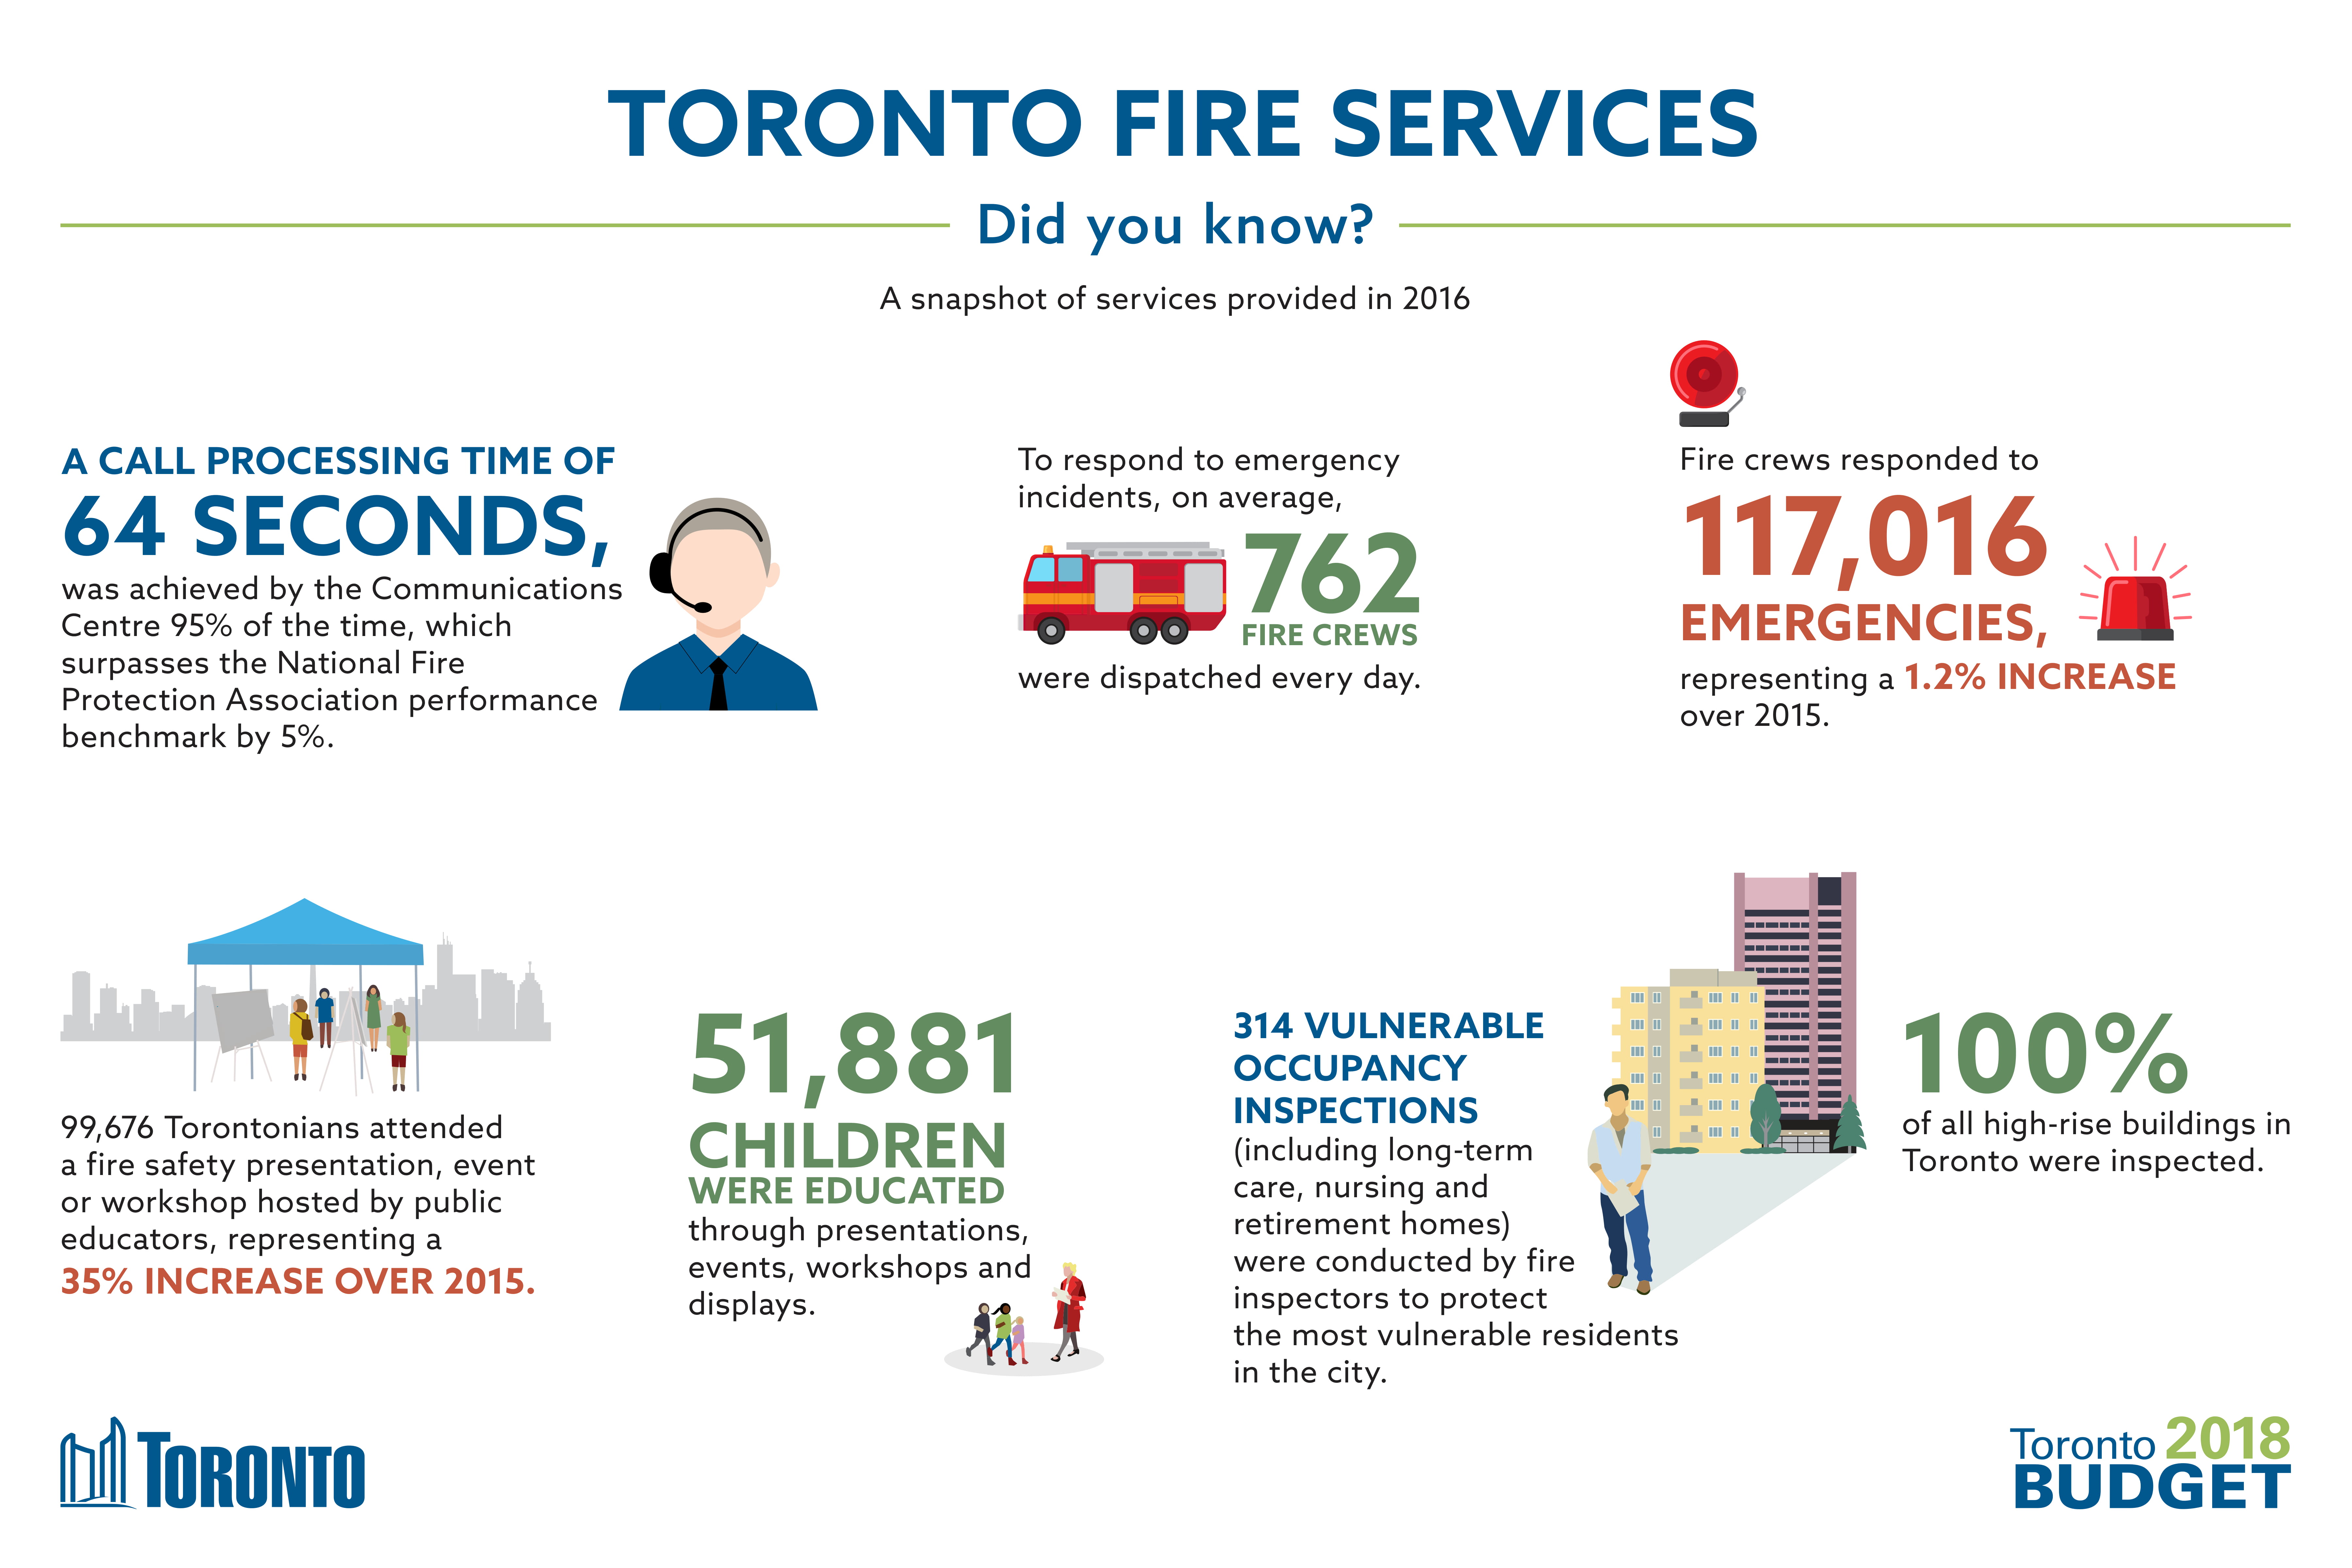
According to the 2016 fire services data:
1. 95% of the time, 64 seconds was the call processing time achieved by Toronto’s Communication Centre, which was a 5% benchmark surpass, of the level set by the National Fire Protection Association.
2. 762 was the average number of crews dispatched every day to deal with emergency incidences.
3. 117,016 was the number of emergencies that the crews responded to, this number representing a 1.2% increase when compared to 2015.
4. 99,676 Torontonians were able to participate in a fire safety presentation, workshop, or event hosted by public educators. This number represents a 35% increase when compared to 2015.
5. 51,881 was the number of children educated through workshops, presentations, displays, and events.
6. 314 – The number of vulnerable occupancy inspections conducted by fire inspectors in a bid to ensure that the most vulnerable residents of Toronto are fire protected. These inspections occurred in many buildings including in nursing, retirement, and long-term care homes.
7. 100% – All high-rise buildings in Toronto were inspected for fire safety standards. The inspectors visited every single high-rise building to ensure all the occupants will be safe in case of a fire break out.
Infograph Credit: https://www.toronto.ca/wp-content/uploads/2017/11/97f9-A1706423_Budget_Infographics_final_Fire.pdf